How to Do a DCF: Build a Cash Flow Model That Values a Business
A practical, step-by-step guide to discounted cash flow analysis—with a repeatable cash flow model you can run on Market Insights Hub.
Quick Start: DCF in 6 Steps
- Load the last 3–5 years of financials (Revenue, EBIT, CapEx, Working Capital).
- Set near‑term growth and margin path; connect CapEx and NWC to the plan.
- Forecast yearly Free Cash Flow for 5–10 years.
- Pick a terminal method (perpetuity growth or exit multiple) and stay conservative.
- Choose a discount rate (WACC) using CAPM for equity and current borrowing costs for debt.
- Reconcile EV → Equity (subtract net debt), then divide by diluted shares.
Overview
Investors ask two simple questions: how much cash can this business generate, and what is that stream of cash worth today? A discounted cash flow (DCF) answers both with a disciplined cash flow model. In this guide I’ll show you how to do a DCF in plain English, then replicate the same steps inside Market Insights Hub so your work is auditable, shareable, and easy to update when realities change.
Why Use a DCF to Value a Business?
A DCF centers valuation on fundamentals—how much cash a business generates and what that cash is worth today—making it a rational, transparent approach that’s less driven by market sentiment.
What Is a Discounted Cash Flow (DCF)?
A DCF estimates the intrinsic value of a company by projecting its future free cash flows and discounting them back to present value using the weighted average cost of capital (WACC). In short: cash today is worth more than the same cash tomorrow. A disciplined DCF forces you to articulate how and why a business generates cash—and what it’s worth given risk and time.
DCF Framework At a Glance
Practically, you’ll forecast free cash flows for five to ten years, estimate what the business is worth beyond that horizon (its terminal value), and discount everything back at a rate that reflects risk (WACC). Add it up for enterprise value, reconcile to equity, and you have an intrinsic value per share. Simple idea, serious rigor.
Core Formulae
- Free Cash Flow (to the Firm), simplified: FCF = EBIT × (1 − Tax) + Non-Cash Charges − CapEx − ΔNWC
- Present Value: PV = CashFlowt / (1 + WACC)t
- Perpetuity Terminal Value: TV = FCFT+1 / (WACC − g)
- Enterprise Value: EV = Σ PV(FCF years 1..T) + PV(Terminal Value)
Build the Cash Flow Model: A Walkthrough
1) Gather Baseline Financials
Start with the story the historicals are already telling you. Pull three to five years of revenue, margins, operating costs, depreciation, capital expenditures, and working capital. Strip out one‑offs so today’s starting point isn’t distorted. You’re building a model that mirrors how the business actually turns sales into cash.
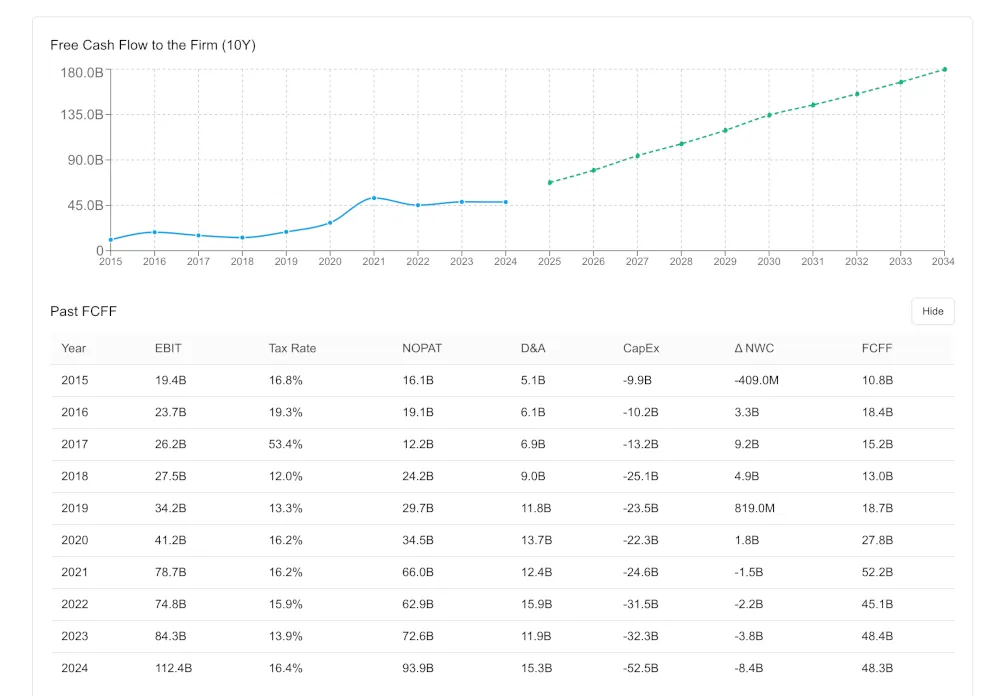
In Market Insights Hub: In the default Intrinsic Value calculator, the last 3–5 years of financials are already preloaded and auto‑mapped into the DCF model—revenue, operating costs, D&A, CapEx, and working‑capital lines land in the right buckets with source tags. The report shows a clean historical FCF bridge and becomes your editable baseline; as new filings are ingested, the history rolls forward without rebuilding the model.
2) Set Your Operating Assumptions
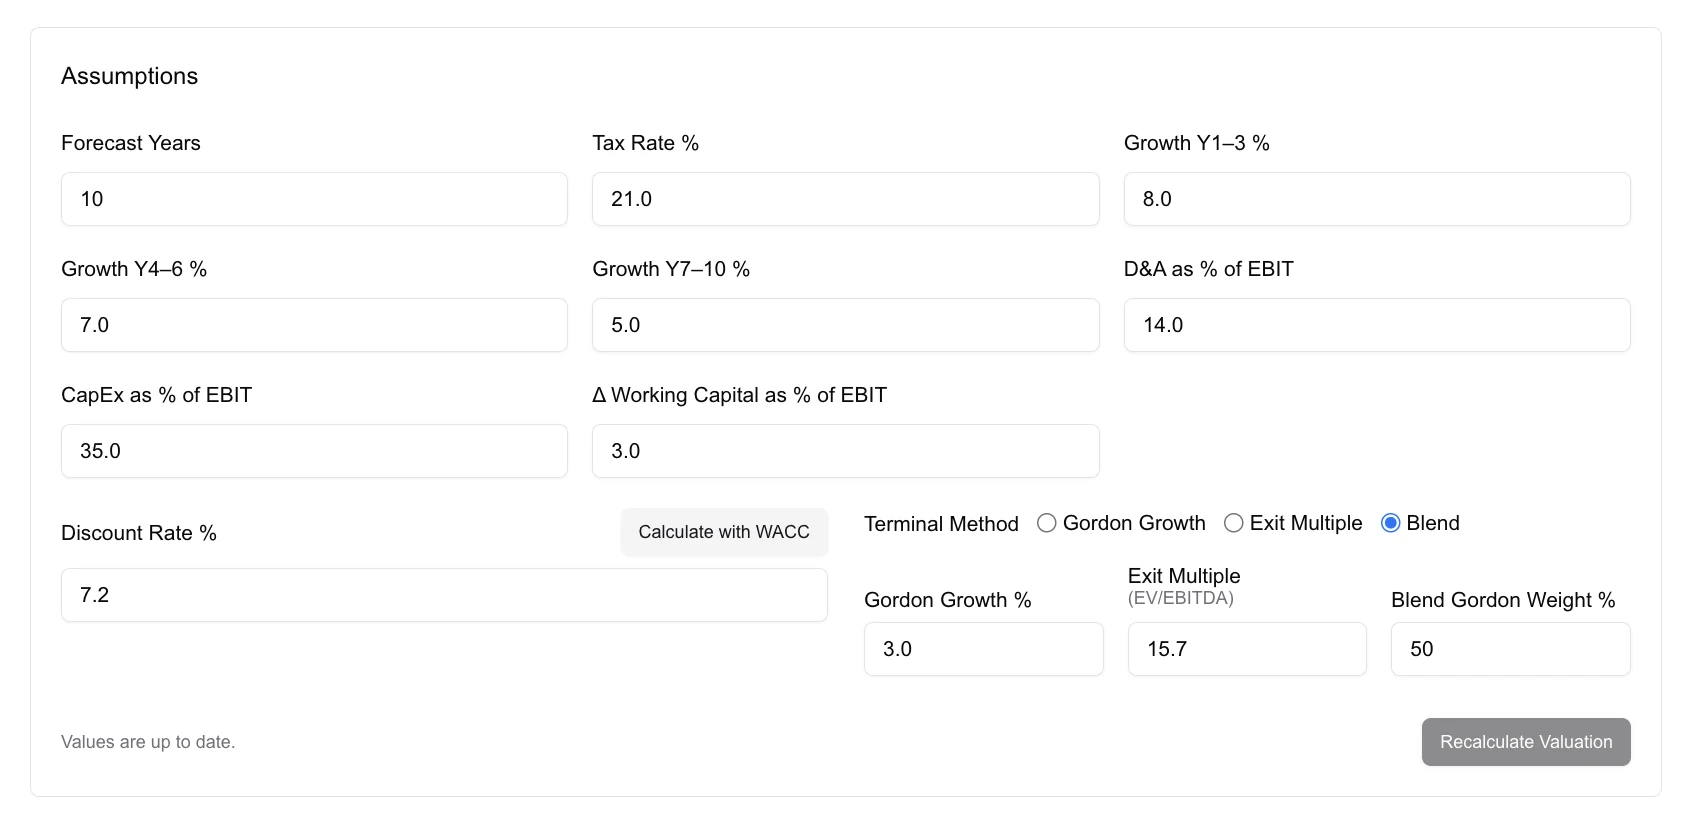
Translate business dynamics into numbers: let faster near‑term growth fade toward a realistic long‑run pace; let margins climb (or compress) as scale, mix, and efficiency change; keep taxes grounded in a normalized rate. Capital intensity matters—growth needs reinvestment—so model CapEx explicitly and connect working capital to how the company sells, produces, and collects.
In Market Insights Hub: Sliders and inputs are annotated with guardrails and peer benchmarks so your assumptions can be defended.
3) Forecast Free Cash Flows (Years 1–5/10)
With the scaffolding in place, march year by year: project revenue, translate it into operating profit, tax it to get NOPAT, add back non‑cash items, then subtract the reinvestment your plan requires (CapEx and the change in working capital). That sequence is your factory for free cash flow.
Tip: Keep the model transparent—avoid single “black box” drivers.
4) Choose a Terminal Value Method
Most of the value often sits beyond your explicit forecast. If you use a perpetuity growth model, let the long‑run rate hug economic gravity (often low single digits). If you prefer an exit multiple, anchor it to steady‑state fundamentals and conservative comps. Either way, write down the rationale—you’ll revisit it.
In Market Insights Hub: Switch methods instantly and see where your terminal picks sit versus sector medians.
5) Select a Discount Rate (WACC)
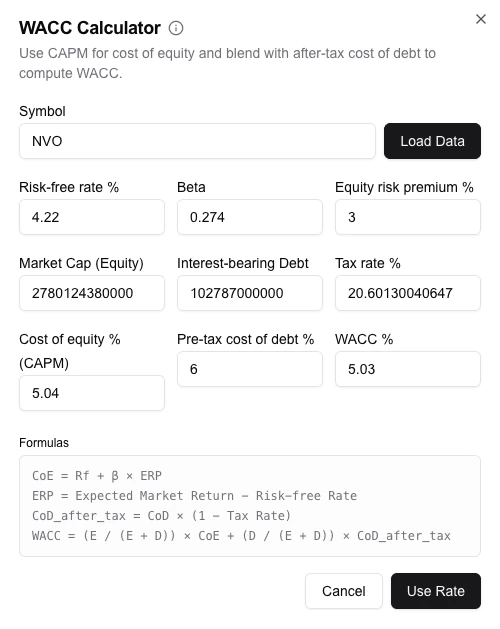
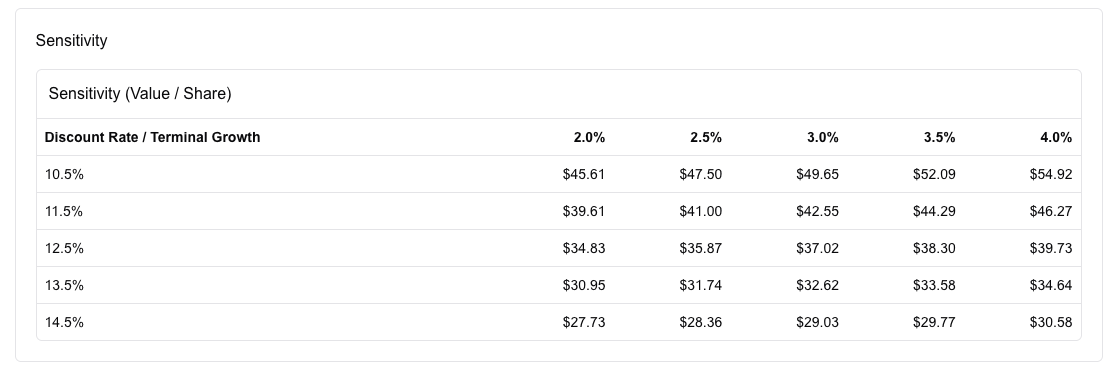
Risk isn’t a footnote. Your WACC blends the cost of equity (via CAPM inputs like the risk‑free rate, beta, and the equity risk premium) with the after‑tax cost of debt. A quarter‑point tweak here—or in terminal growth—can shift valuation ranges meaningfully, which is why we always pair a base case with sensitivities.
In Market Insights Hub: CAPM inputs are prefilled with sources and justifications; sensitivities render automatically.
CAPM, briefly
The Capital Asset Pricing Model estimates the cost of equity (Re) as:
Re = Rf + β × ERP + RPsize + RPcountry (optional adjustments)
- Rf (risk‑free rate): Typically a long‑dated government bond yield aligned with your currency (e.g., 10Y–20Y U.S. Treasury for USD models).
- β (beta): Sensitivity of the stock’s returns to the market. Estimate via regression or use a sector median, then unlever/relever to match target capital structure.
- ERP (equity risk premium): Expected excess return of the market over Rf. Use a reputable source and keep it consistent across comps.
- Size/Country premia: Optional add‑ons for smaller firms or specific country risk where warranted.
Estimating beta correctly
If you start from observed (levered) betas of peers, unlever and relever to your target debt level:
βunlevered = βlevered ÷ [1 + (1 − T) × D/E]
βtarget = βunlevered × [1 + (1 − T) × (D/E)target]
WACC formula
WACC = (E / (D + E)) × Re + (D / (D + E)) × Rd × (1 − T)
- E, D: Market value of equity and debt (use market values, not book, where possible).
- Rd (cost of debt): Current pre‑tax borrowing rate for comparable tenor, adjusted for company credit profile.
- T (tax rate): Marginal statutory or normalized effective rate, depending on context.
Practical defaults for beginners
- Set Rf to your home‑currency 10Y government bond yield.
- Use a published ERP source; keep it consistent across companies.
- Start beta at your sector median; later, unlever/relever to your target capital structure.
- Use your company’s current marginal borrowing rate for Rd; apply the tax shield (1 − T).
- Run a small 5×5 sensitivity on WACC and terminal growth to see a reasonable valuation range.
6) Convert Enterprise Value to Equity Value
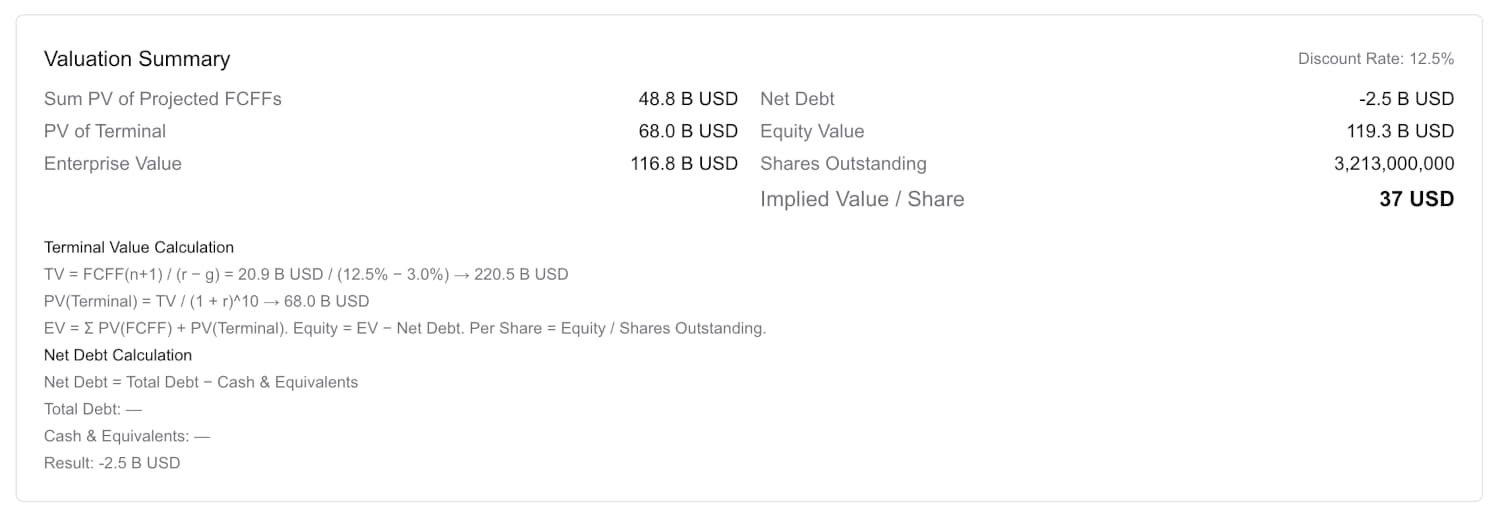
Your DCF yields enterprise value—the value to all capital providers. Move from EV to equity by subtracting net debt, layering in non‑operating assets or liabilities, and accounting for minority interests. Divide by diluted shares for a per‑share number you can actually compare to the screen.
In Market Insights Hub: The reconciliation view documents each adjustment so reviewers can follow the chain of custody.
7) Validate With Sensitivities and Scenarios
No single number survives first contact with reality. Frame a range with scenario packs—conservative, base, optimistic—and read the sensitivity tables for what’s doing the heavy lifting (WACC versus g is a classic). Always cross‑check the implied steady‑state multiples against peers.
In Market Insights Hub: Generate the pack and export it—comments included—in seconds.
How Market Insights Hub Helps
The platform handles the plumbing so you can focus on the judgment calls: fundamentals map directly into the cash flow model; assumptions are transparent and benchmarked; sensitivities and scenarios are one‑click; and the EV→equity reconciliation is audit‑ready with clean exports for your memo.
Ready to build your first model? Open a company and launch the DCF Builder.
Explore related tools: try the Stock Screener for idea generation or review the Fundamental Analysis Guide to sharpen your assumptions.
Glossary (plain English)
- DCF: A way to value a business by projecting future cash and discounting it back to today.
- Free Cash Flow (FCF): The cash a business generates after the investment it needs to keep growing.
- WACC: The blended rate of return investors require for both equity and debt—your discount rate.
- Terminal Value: What the business might be worth beyond your detailed forecast period.
- Beta (β): How volatile a stock is versus the market; higher beta → higher required return.
- ERP: The extra return investors expect from stocks over risk‑free bonds.
FAQ
How many years should I forecast?
Five is common for stable companies; up to ten for high‑growth names. Longer horizons increase uncertainty—use scenarios.
Which terminal method should I pick?
Perpetuity growth is cleaner for mature firms; exit multiples can be intuitive but should reflect steady‑state fundamentals.
What if I don’t know the “right” WACC?
Pick a reasonable base and show a range. A sensitivity grid around WACC and terminal growth is standard practice.